
In Python Beginner Lesson 18, we cover a taste of data analysis in detail at a beginner-friendly level. The final goal of this lesson is to read CSV data as a table, summarize it, and save it as a graph. Instead of stopping at copying code, we also check why this syntax is used and where beginners often make mistakes.
One major reason many people learn Python is data analysis. At the beginner stage, it is more important to experience the flow of reading data, checking averages, and saving a graph than to study complex statistics. Today’s example is small, but it becomes a basic skeleton for later automation, data analysis, and web API learning.
What You Will Learn in This Lesson
- Core topic: a taste of data analysis
- Today’s goal: read CSV data as a table, summarize it, and save it as a graph
- Practice flow: understand the concept → run the example → review the code → try an applied task
- Recommended study time: 30–50 minutes
Understand the Big Picture First

When learning a taste of data analysis, the most important thing is not memorizing grammar names. You need to understand what role this concept plays inside a real program. At the beginner stage, keep asking the following three questions.
- Where did this value come from?
- In what order does this code run?
- Where should I save the result if I want to use it again?
Look Closely at the Core Concepts
- pandas handles table data with a structure called a DataFrame.
- matplotlib is a representative tool for drawing graphs.
- External packages must be installed with pip install.
- Analysis is more stable when you proceed in the order of reading, checking, summarizing, and visualizing.
At first, explanations alone may feel abstract. That is why it is helpful to run the example below right away and check the concept with your own eyes.
Beginner Terms You Should Know
| Term | Simple explanation |
| DataFrame | pandas data in a table shape with rows and columns |
| Visualization | The task of showing data as graphs or charts |
| Virtual environment | A way to separate package installation spaces by project |
Practice Setup
Create a new Python file and run the example below. Using lowercase English letters and numbers in the file name helps reduce errors. For example, save it as lesson.py or practice_01.py. After entering the code, do not change many things at once. Change it little by little while checking the result each time.
Example Code
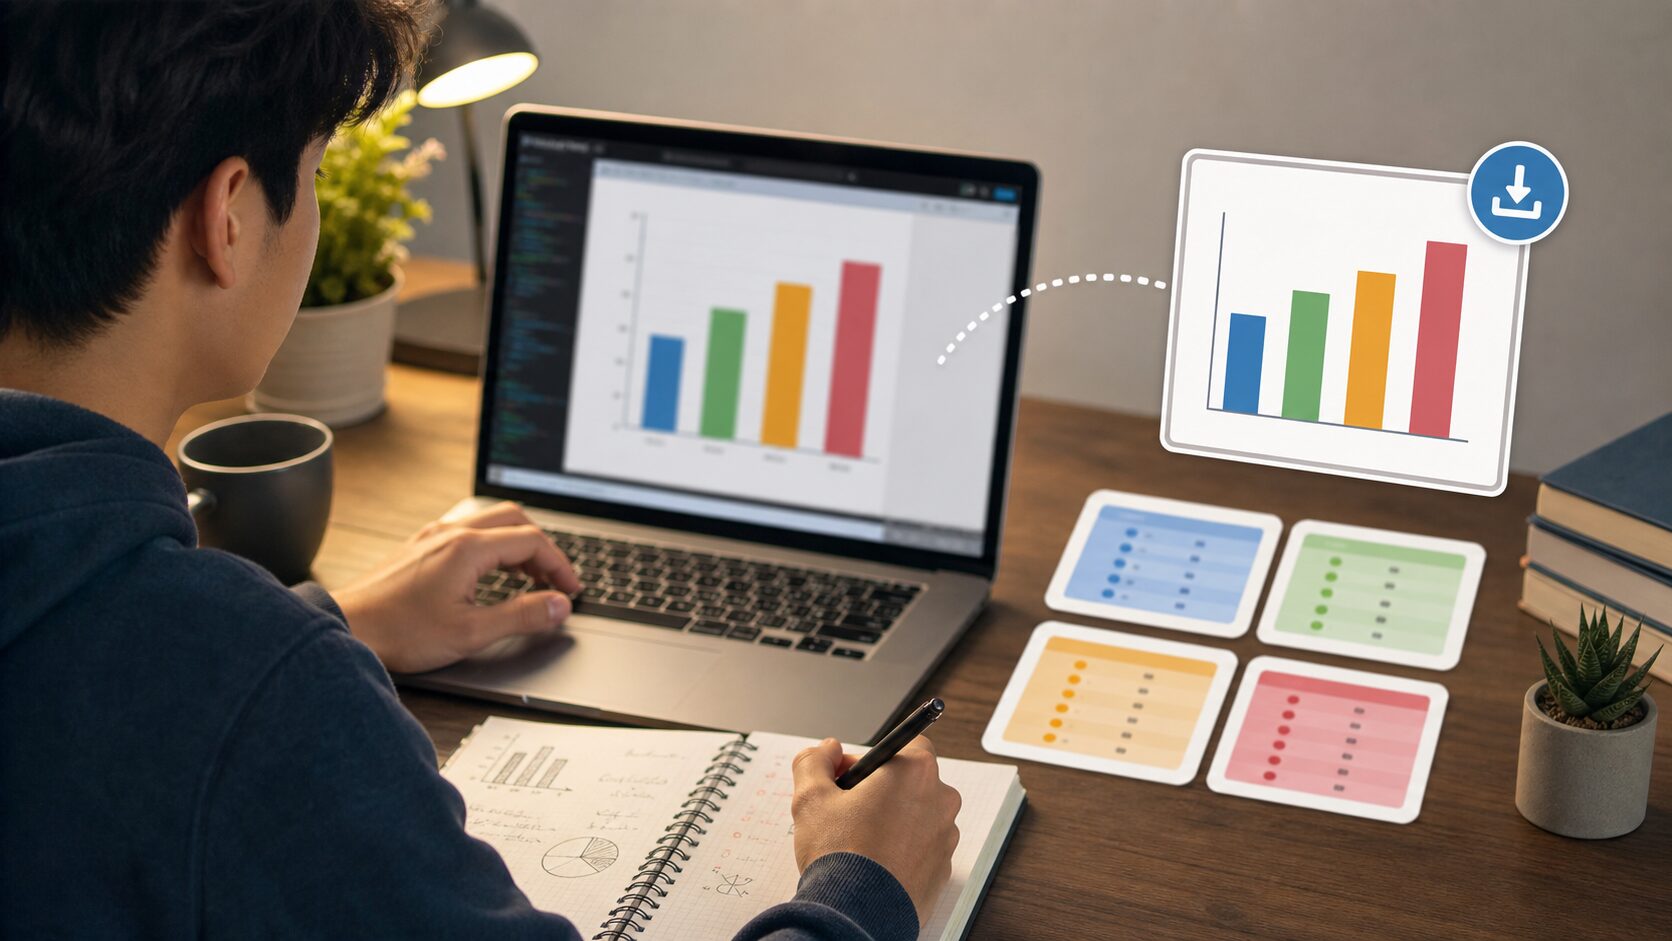
If you summarize data and save it as a chart image, you can use the analysis result in other documents or reports.
import pandas as pd
import matplotlib.pyplot as plt

data = pd.DataFrame({
    "month": ["Jan", "Feb", "Mar"],
    "sales": [120, 150, 180]
})

print(data)
print("Average sales:", data["sales"].mean())

data.plot(kind="bar", x="month", y="sales", legend=False)
plt.title("Monthly Sales")
plt.tight_layout()
plt.savefig("sales.png")
Understand the Code Line by Line
- pd.DataFrame creates a small table of data.
- data[“sales”].mean() calculates the average sales value.
- plot(kind=”bar”) draws a bar chart.
- savefig() saves the graph as an image file.
The important point at this stage is the “reading order” of the code. Python runs from top to bottom. Even when there are exceptional flows such as functions or conditions, beginners should first get used to the basic top-to-bottom flow.
Change Values and Check the Result
If the example code runs, now change only a very small part. Start with small changes such as one number, one string, or one variable name so errors are easier to find. After changing something, always save and run the file again.
| Part to change | What to check |
| Input value or variable value | Check how the result sentence changes. |
| Output sentence | Check whether the explanation becomes friendlier for the user. |
| Code order | Check whether changing the order causes an error or changes the result. |
Common Errors and How to Fix Them
| Error or situation | Why it happens | How to fix it |
| ModuleNotFoundError | This is a common beginner-stage problem. | Install the packages with pip install pandas matplotlib. |
| Broken Korean font rendering | This is a common beginner-stage problem. | Font settings may be needed depending on the operating system. |
| CSV encoding problem | This is a common beginner-stage problem. | Use read_csv(…, encoding=”utf-8″) or cp949 depending on the situation. |
When an error occurs, first look at the last line of the error message. Then check the file name and line number. Most beginner errors happen around parentheses, quotation marks, indentation, variable names, and type conversion.
Practice Problems to Try on Your Own
- Create monthly visitor data and calculate the average.
- Draw a line graph instead of a bar graph.
- Change the example so it reads a CSV file with read_csv().
When solving practice problems, do not look for the answer code right away. First write the input, processing, and output flow on paper. Once the flow is visible, the code becomes much easier to write.
Where Does This Connect in Real Work?
A taste of data analysis does not end with a small example. It appears again and again when organizing files in business automation, reading table data in data analysis, and handling response values in web APIs. The beginner syntax you learn now also becomes the basic language you use later with tools such as pandas, requests, and FastAPI.
A Beginner-Friendly Analogy
When you first see a taste of data analysis, syntax symbols may catch your eye first. But if you look at syntax only as symbols, you will quickly get tired. A better method is to understand it by role. The core of this lesson is to read CSV data as a table, summarize it, and save it as a graph. In other words, you are practicing how to decide what job to give Python and write the order of that job as code.
Think of a cooking recipe. You prepare ingredients, handle them in order, control the heat, and finally serve the dish. Python code is similar. You prepare the needed values, process them in a defined order, and print or save the result. For beginners, building this sense of order is the most important part.
Follow the Execution Flow Visually
Before running code, think in the following three boxes. This habit helps not only with simple examples but also later when you build longer projects.
| Section | Question to check | Meaning in this lesson |
| Input | What value does the program receive first? | Values the user enters or values written in advance in the a taste of data analysis example. |
| Processing | What calculation or decision happens? | The part Python runs in order to achieve the goal: read CSV data as a table, summarize it, and save it as a graph. |
| Output | What result does the user check? | This may be a print result, saved file, created graph, or changed data. |
Simply filling in this table yourself improves code comprehension. Beginners struggle partly because they do not know syntax, but more often because they cannot separate input, processing, and output flow.
Debugging Routine: What to Check When an Error Happens
When an error appears, do not delete code at random. If you check in the order below, you can find most beginner errors yourself.
- Read the last line of the error message.
- Check the file name and line number.
- On that line, check parentheses, quotation marks, colons, and commas.
- Check whether the variable name exactly matches the name defined above.
- Check whether a value that should be calculated as a number is still a string.
- Undo the part you just changed and run the code again.
If you repeat this routine, errors begin to look like clues instead of something scary. Python skill grows more from reading and fixing errors than from avoiding them completely.
Application Ideas: Grow Today’s Lesson a Little
Once this example feels familiar, keep the a taste of data analysis example and change one thing: an input value, an output sentence, a saving method, or a repeat count. You do not need to make a completely new example. At the beginner stage, many small variations are the best practice.
- Change variable names in the example to make them more meaningful.
- Refine output sentences so they read like guidance shown to a real user.
- Deliberately check what happens when invalid input is entered.
- Explain the code with comments to check your own understanding.
- Try making the same result in a slightly different way.
Lesson Checkpoints
- ☐ I can explain in words why a taste of data analysis is needed.
- ☐ I ran the example code myself.
- ☐ I can explain the role of at least three lines of code.
- ☐ When an error occurred, I checked the last line and the line number.
- ☐ I changed and ran at least one practice problem on my own.
Related Articles
- Python Beginner 20-Lesson Complete Guide
- Previous lesson: Python Beginner Lesson 17: Introduction to Folder and File Automation
- Next lesson: Python Beginner Lesson 19: Fetch Web Data and APIs with requests
- Business automation article collection
FAQ
Can I follow Python data analysis even if I am completely new to Python?
Yes. This lesson is written for readers who are learning programming for the first time. Focus on understanding the execution result and flow rather than memorizing the code.
I followed the example exactly, but I get an error. What should I check first?
Check parentheses, quotation marks, colons, indentation, and variable names first. Many beginner errors happen because quotation marks were entered strangely or a variable name differs by one character.
The example code looks too short. Should I study longer code?
At the beginner level, short code is better. The most stable way to improve is to understand short code accurately, then change values and add features one by one.
What should I do next?
Change and run at least one practice problem from this lesson. Then move to the next lesson, where the concepts you learned earlier will appear again naturally.
Next Lesson Preview
The next lesson is Python Beginner Lesson 19: Fetch Web Data and APIs with requests. Based on the flow you practiced here, you will explore web data and APIs in more detail.
References
- Python Official Tutorial
- Python Official Tutorial: Control Flow Tools
- Python Official Tutorial: Data Structures
- Python Official Tutorial: Modules
- Python Official Tutorial: Input and Output
Original Korean article: https://www.thinknote.co.kr/python-beginner-18-pandas-matplotlib/